Methodology
Calculations
Pollster weights: Each pollster is graded based on how accurate their historical polls have been compared to actual election results. Polling errors for more recent elections influence grades more than older elections. The effect of each election in this calculation is reduced 5% per year. We use a decay factor to achieve this.
Weight of each historical poll:
Pollster weight:
Square rooting keeps the effect of number of polls analyzed limited. If we devised a formula that doesn't use the number of polls at all, then pollsters who got lucky with 1 or 2 very accurate polls would have been rewarded unfairly. Let's use this formula to calculate the weight of a pollster like Aksoy. Aksoy has 2 public polls. 2015 general election from 8 years ago and the 2019 İstanbul mayoral election from 4 years ago. Their decay factors are 0.958 = 0.66 and 0.954 = 0.81. Their respective error margins are 1.48 and 0.39. We multiply them with these coefficients and average them:
We then inverse it and multiply it with the square root of number of polls:
This pollster has a weight of 2.17. Once all pollsters weights are calculated, pollsters are graded on a bell curve with A, B, C, or D. These grades are for UI-purposes only. The model uses pollster weights and not these grades.
Poll weights: The model also assigns weights to polls just like it does to pollsters.
Weight of each poll for the upcoming election:
Polls for the upcoming election also have decay factors just like historical polls do. This time, we look at the number of days since poll instead of the number of years. 0.95Days since poll. And the sample size weight is calculated as √ Sample size / 1000 . This formula rewards sample sizes up to 2500, since poll accuracy gets diminishing returns after a certain point.
Probability: The model assumes a normal distribution of outcomes and uses a dynamic standard distribution. It starts with 10 and gets smaller and smaller each day as the election approaches.
Let's assume a candidate is projected to receive 52% of the votes. Since 50% is enough to win, this candidate is 2 points ahead of the target. We can draw a standard distribution of outcomes with 5 as our standard deviation.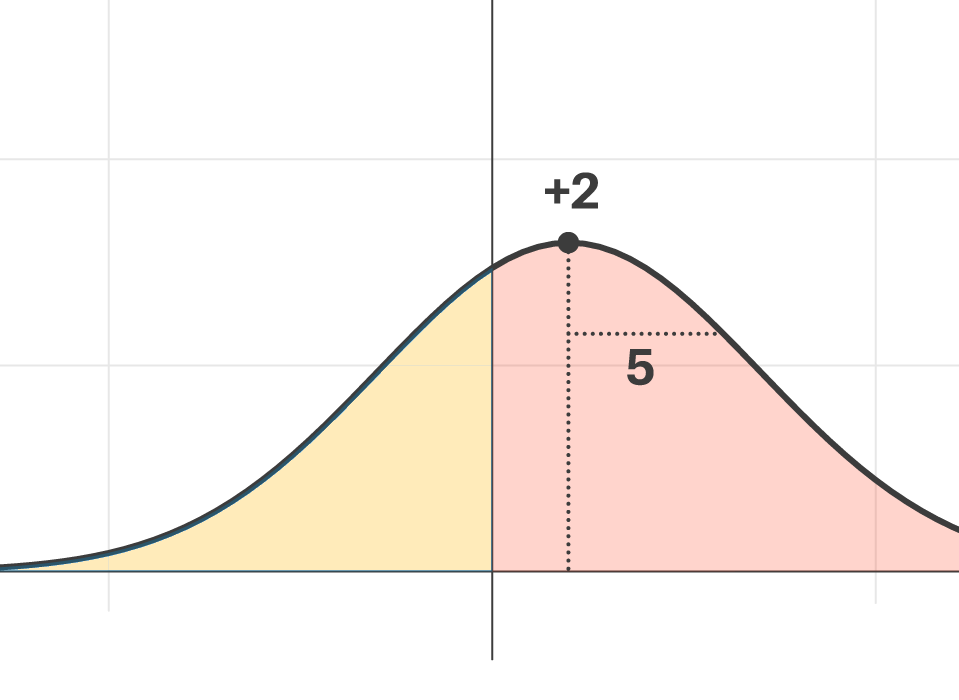 To calculate this candidate's probability of winning, we can use the cumulative probability distribution function which gives us 66%. If we have the election 3 times, this candidate would be expected to win 2 of them.
Seat distribution: Polls are not regional and they focus only on national popular vote. That's why the model calculates voter leanings from the 2018 general election and uses the projected national popular vote to forecast local results. Each alliance has a voter leaning coefficient in each district, which is calculated by dividing the 2018 local vote of the alliance to their 2018 national vote.
Seat distribution forecast is probably the least accurate part of the model. The main reason for this is the fact that we don't have polls for individual districts. The model has to make a big assumption which is voter leanings have not changed. In addition, the way parties nominate candidates within some alliances further complicate the calculation. The model keeps these parts simple and simply does a D'Hont calculation using total alliance votes. This projection is still useful to demonstrate electoral advantages of parties. Since the vote of AK Parti is spread out fairly evenly and it is competitive in most provinces, its vote is more efficient. This means it can win more seats with lower national vote percentages. For instance, in 2018, Cumhur Alliance received 1.58 times more votes than Millet Alliance, but won 1.82 times more seats than them.
House and Senate projections in the US are far more accurate because forecasters have polling data in each election district. The winner-take-all system further simplifies forecasting. That being said, national vote-basd forecasts in our model are still useful in terms of probabilistic calculation. For instance, if this model expects an alliance to win 250 seats, it would be fair to say the chances of that alliance reaching a majority (301 seats) is not very high.